The National Association of REALTORS® provides national and regional market updates including a report for our local Hagerstown/Martinsburg area covering both Washington County, Maryland and Berkeley County, West Virginia. Find the full report below for your review; this report and supporting information can also be found on their website, www.nar.realtor.
Let’s review excerpts of the report together as it isn’t just relevant to potential home buyers or sellers, it also provides information to current homeowners about the equity they have in their home!
Median Housing Price Analysis
On page 1, a combined line and bar graph shows the impressive growth in median housing price for our area over the past 9 years. It’s important to recognize that the average American lives in their primary residence for approximately 7 years, hence the relevance of this line and bar graph. Interestingly, the median price (shown by the red line graph) showed very little change from 2013 to 2016 and there was actually a year-on-year price decrease during two quarters (shown by the blue bars).
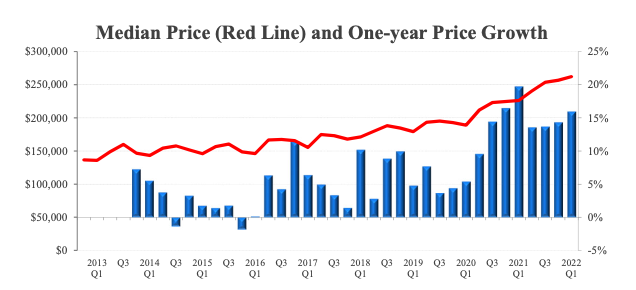
There was 46% appreciation or increase in the median home value for a home in our area over the past 3 years which equates to an increase in home equity for the typical homeowner during this same period! Although the average home price in our area is $100,000 lower than the national average, our rate of appreciation was slightly higher than the national average. The median local homeowner increased their home equity by $83K during the past 3 years, by $116K over the past 7 years, and by $126K over the past 9 years not including principal paid through mortgage payments (see page 2 for data regarding increase in equity including these payments).
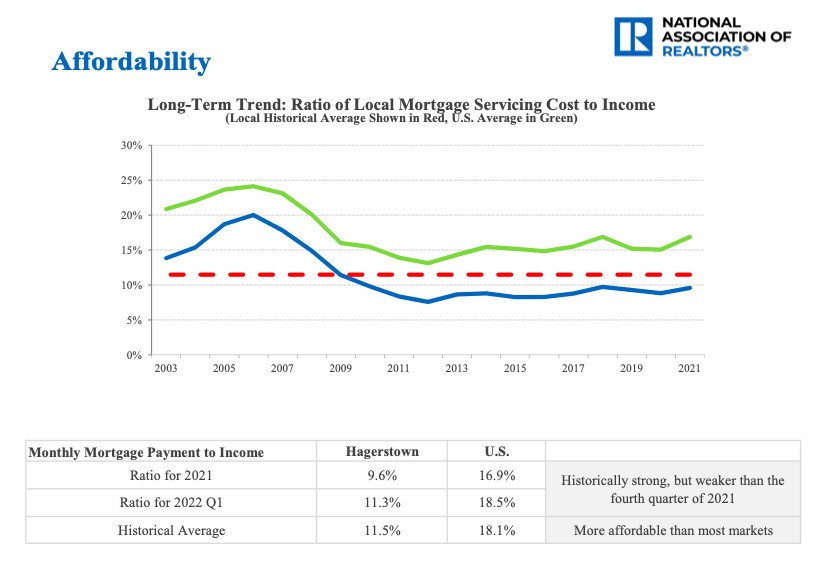
Mortgage Cost to Income Ratios
On page 5 of the National Association of REALTORS® local market report, we find a measure of affordability of owning a home based on the ratio of mortgage costs as a percentage of total household income. The graph compares the mortgage cost to income ratio in our area (the blue line) to the historical average of our area (the dotted red line) and to the national average (the green line). As you can see, our area has followed the increases and decreases of the national average but our mortgage servicing cost to income ratio has consistently remained lower, and therefore more affordable, than the national average!
From 2003 to 2009, the mortgaging cost to income ratio was very high relative to our historical average of just below 12%. It’s important to note that our historical average is below even the best national average. As we begin to move toward another recession, it is likely that our ratio will again increase above our historical average but our area will continue to be more affordable than the national average. This increase would be attributed to mortgage costs increasing more than household income.
Conclusion & Full Report
Statistics and data are important indicators of the economic health of our area but it is important to note a few things as you read these excerpts and the full report below. First, the market has already changed significantly since the first quarter – as soon as the second quarter report is issued, it will be shared here! Second, although local market trends are more relevant to local homeowners and potential homeowners, each individual must consider their own specific situation with regards to home equity, mortgage cost, income, etc.